GUIDESAT
The SAT Desmos Tier List: A Guide

Benson Wong
Crackd Blogger
SAT Taker: “Yo, how much are these two Cokes?”Me: “They’re 1.49$ each, it’s just double that.”Him: “Wait, give me a second, let me pull out Desmos and use custom regression…”
Don’t be him.
Introduction
From solving systems of equations, graphing intersecting functions, and custom regressions that spit back answers, Desmos does it all. Though most published Desmos guides offer countless tips and tricks, I’ve noticed one thing: at times, it’s actually quicker to do it with pen and paper than using methods they offer.
So then, which Desmos tricks are ACTUALLY worth doing? In this guide, I’ll be ranking tricks from most timesaving to least timesaving, starting with the basics.
Desmos for Dummies: The Basics
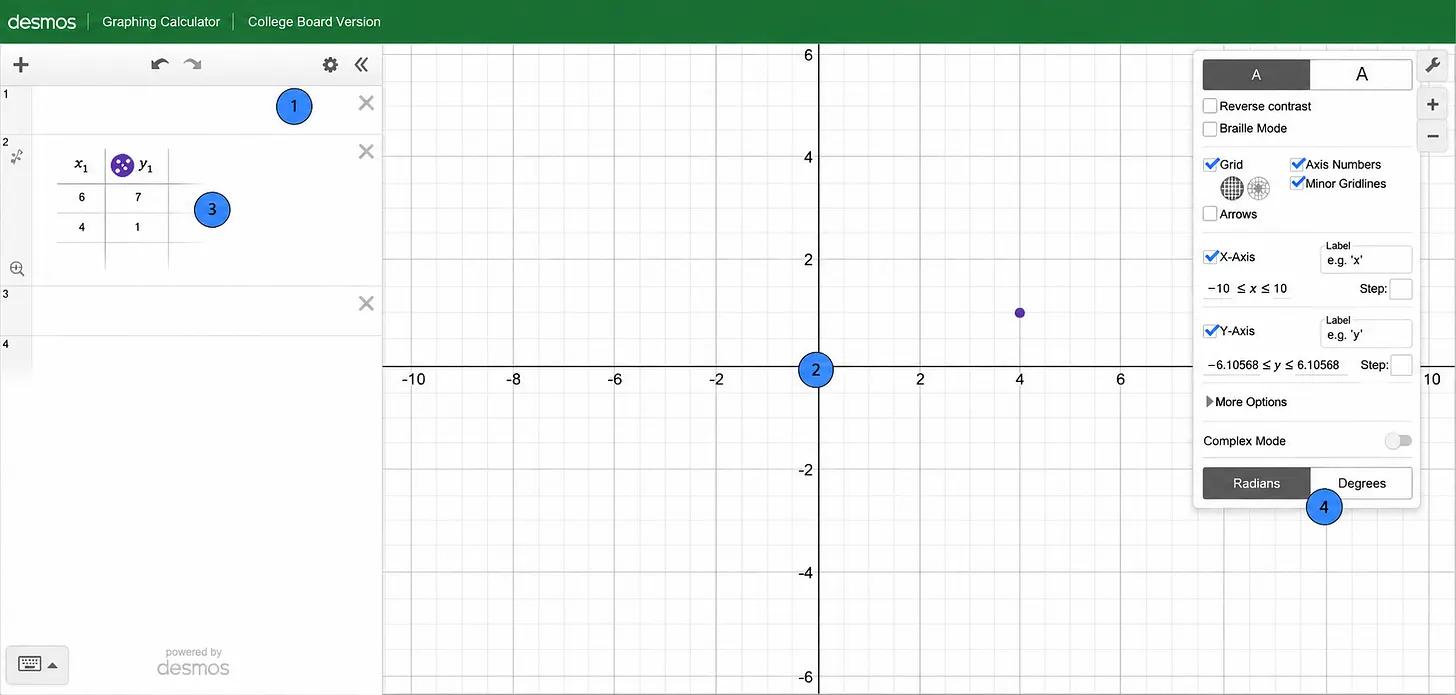
When opening Desmos for the first time, you’ll find:
-
The expressions list, where you can enter equations, points, or tables.
-
Graph paper, where functions, points, and curves are visualized.
-
Tables, where relationships between variables are shown.
-
Graph settings, where you can switch from radians to degrees when evaluating trig.
Arithmetic should be simple, but some operators might require a bit of practice to memorize and use efficiently:
-
sqrt(x), cbrt(x) and nthroot(x):
- evaluates radicals given an index → arithmetic and algebra ✅.
-
mean(p), median(p), mode(p), range(p), and stdev(p):
- evaluates a data set’s characteristics respectively → statistics problems ✅.
-
distance(A, B) and midpoint(A, B):
- evaluates the distance and midpoint between two points respectively → circle problems ✅.
-
gcf(p) or gcd(p):
- finds the greatest common factor between a set of numbers → factoring and quadratics ✅.
-
typing “table” in the expressions list:
- opens a table, where you can regress functions based off of points on the graph paper → function regression ✅.
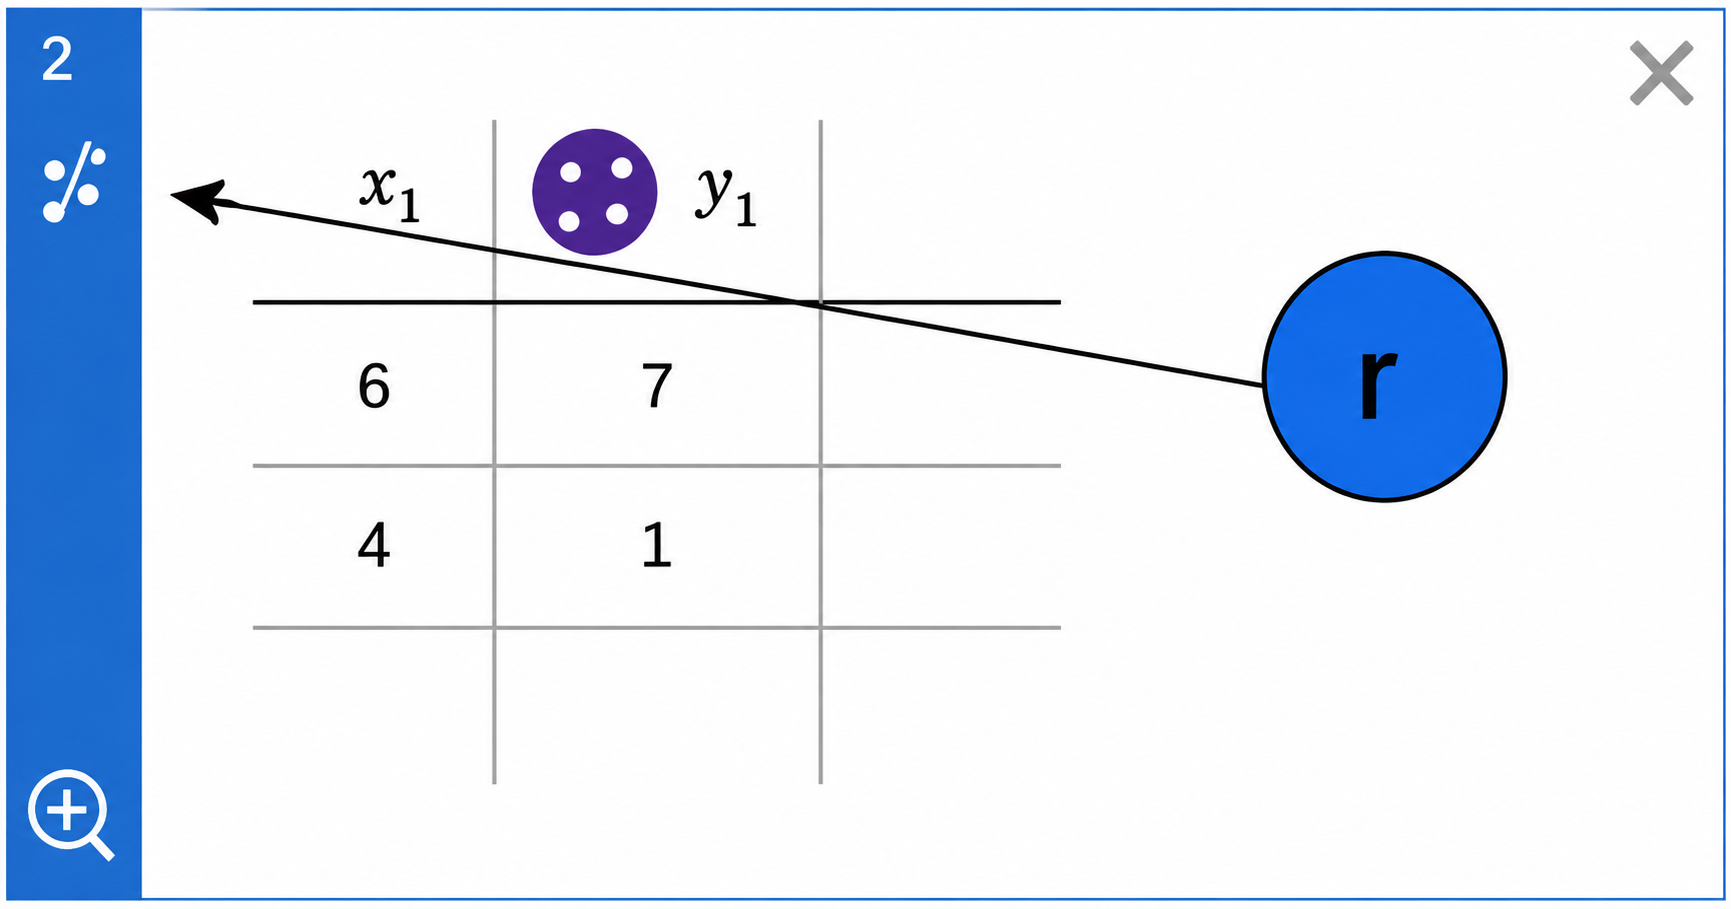
- opens a table, where you can regress functions based off of points on the graph paper → function regression ✅.
-
a ~ b
- acts as a solver on Desmos, using knowns to automatically solve for constants → constant questions ✅.
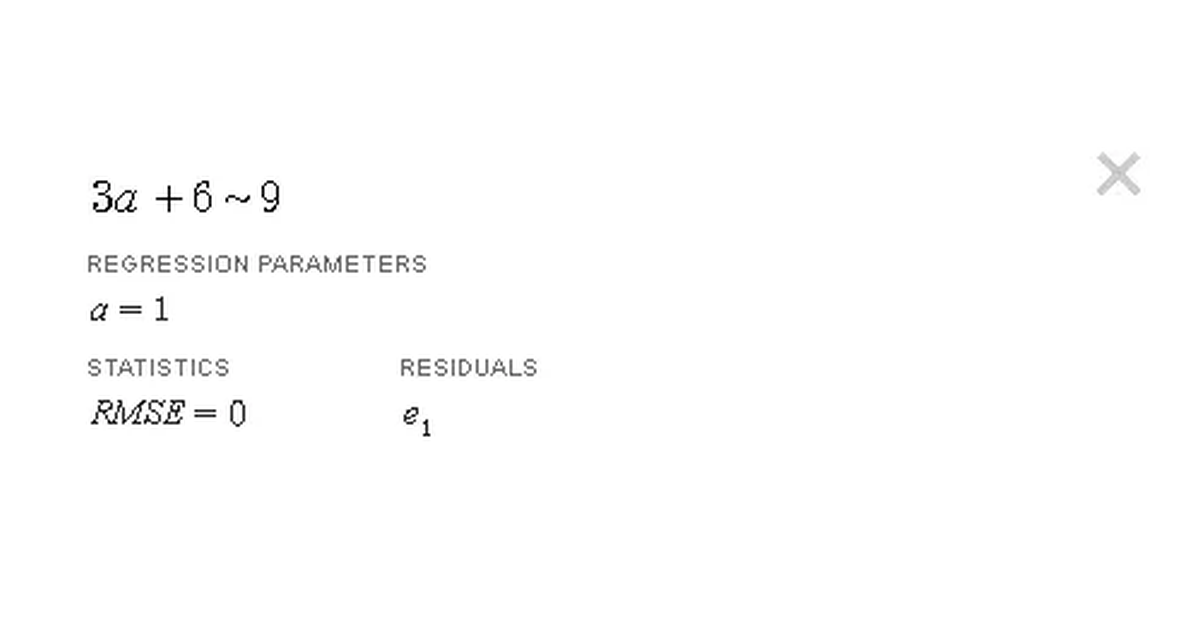 Quick note: any variable outside of x, y, and r become sliders, where you can assign values to them → important for equivalency problems ✅.
- acts as a solver on Desmos, using knowns to automatically solve for constants → constant questions ✅.
🥇: Regression, Systems, and Equivalency
If you can’t solve it without paper, always use Desmos for these.
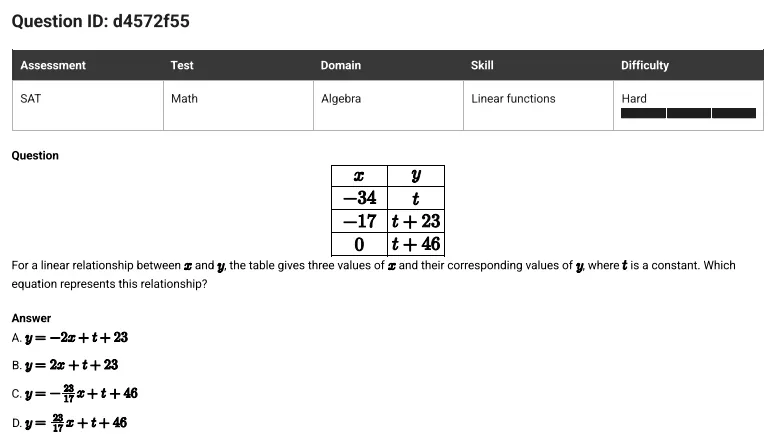
Example 1:
-
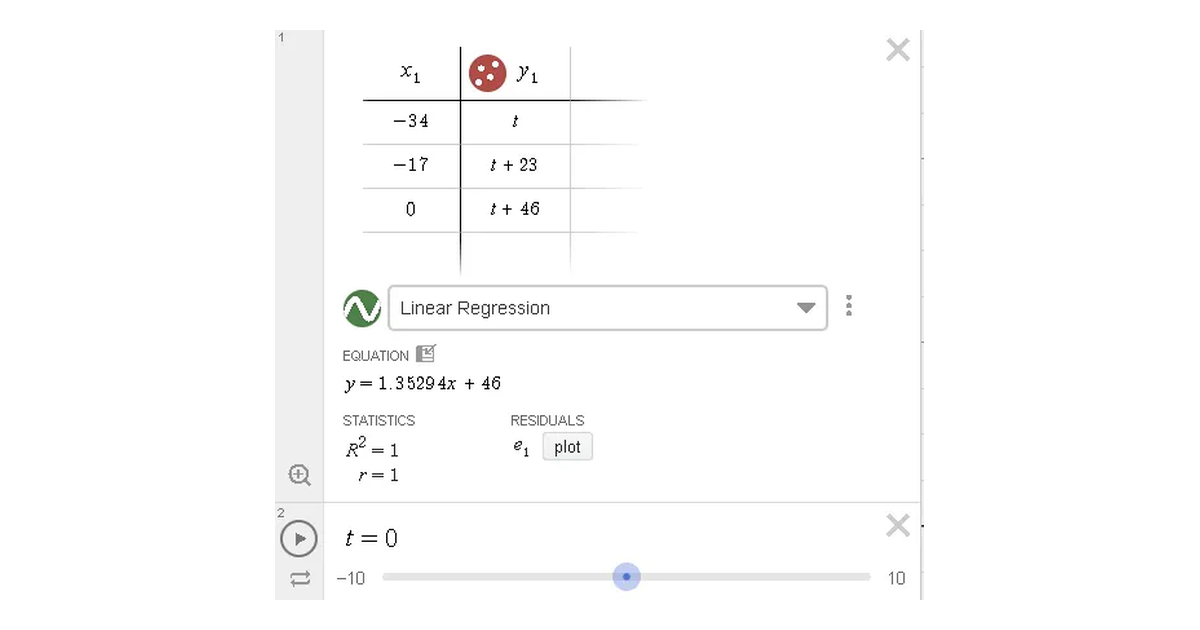
Because t is a constant with no restriction, let t = 0 for simplicity.
-
In the equation list in row 1, create a table, transcribing the original problem
-
In row 2, let “t=0”.
-
Regress, and pick the best answer: D (because the slope is positive and below 2).
Example 2:
-
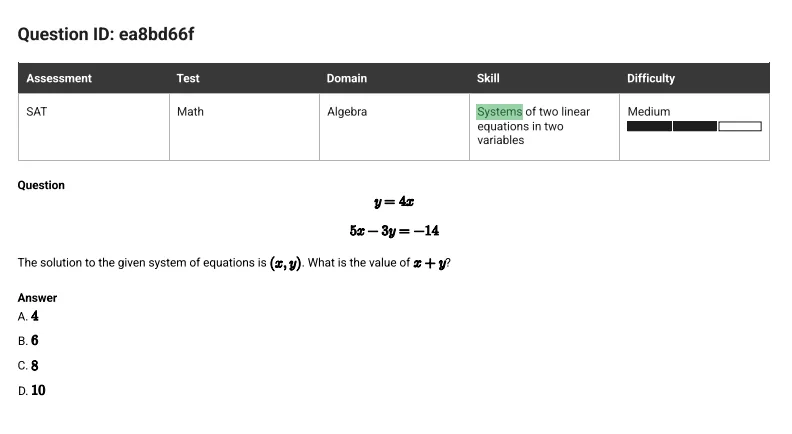
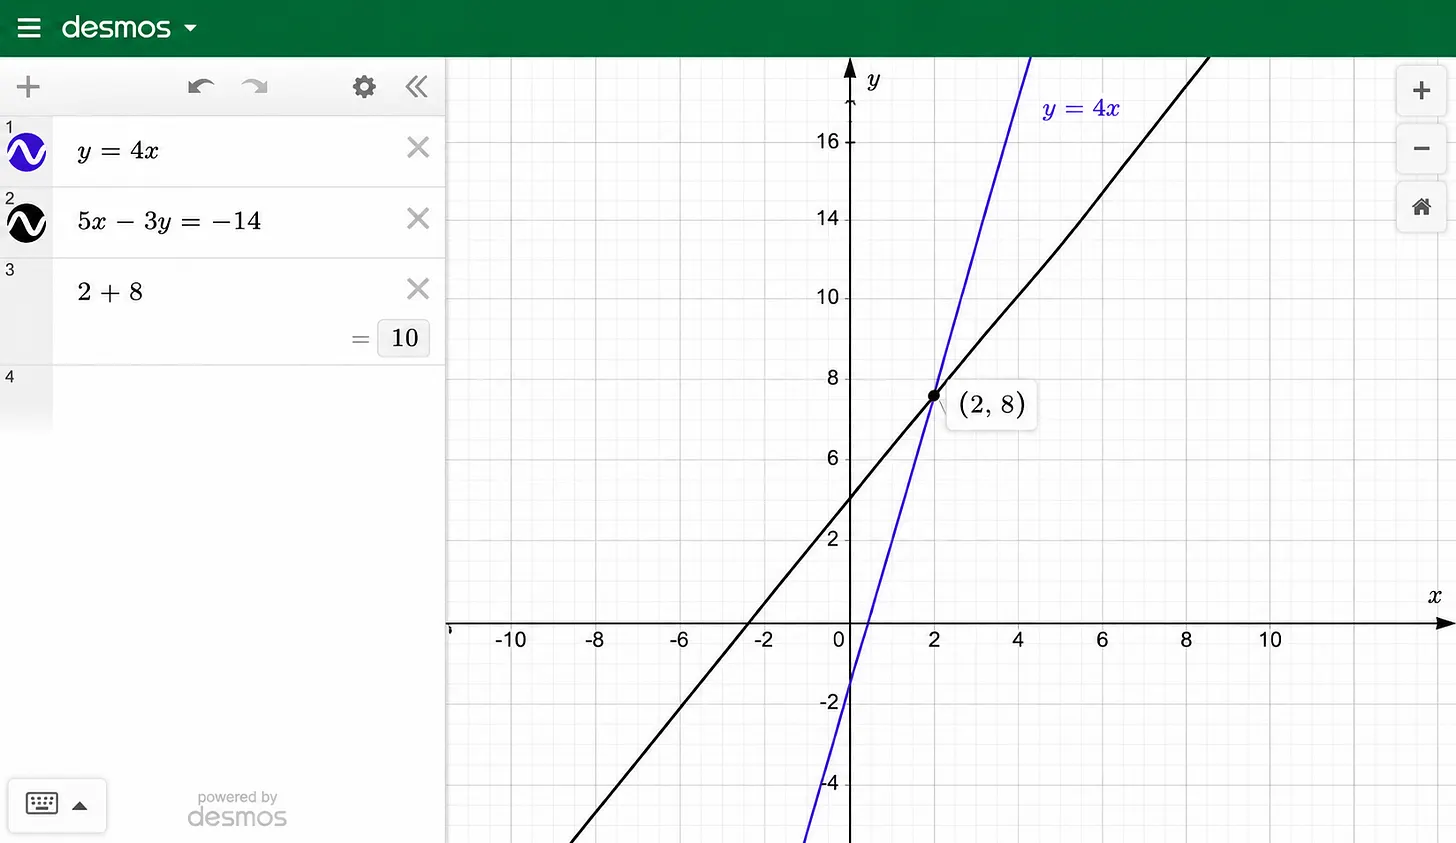
Transcribe both equations on the equation editor, and find (x, y) where both lines intersect (the point should already be highlighted).
-
Add the x-coordinate with the y-coordinate to find the answer: D.
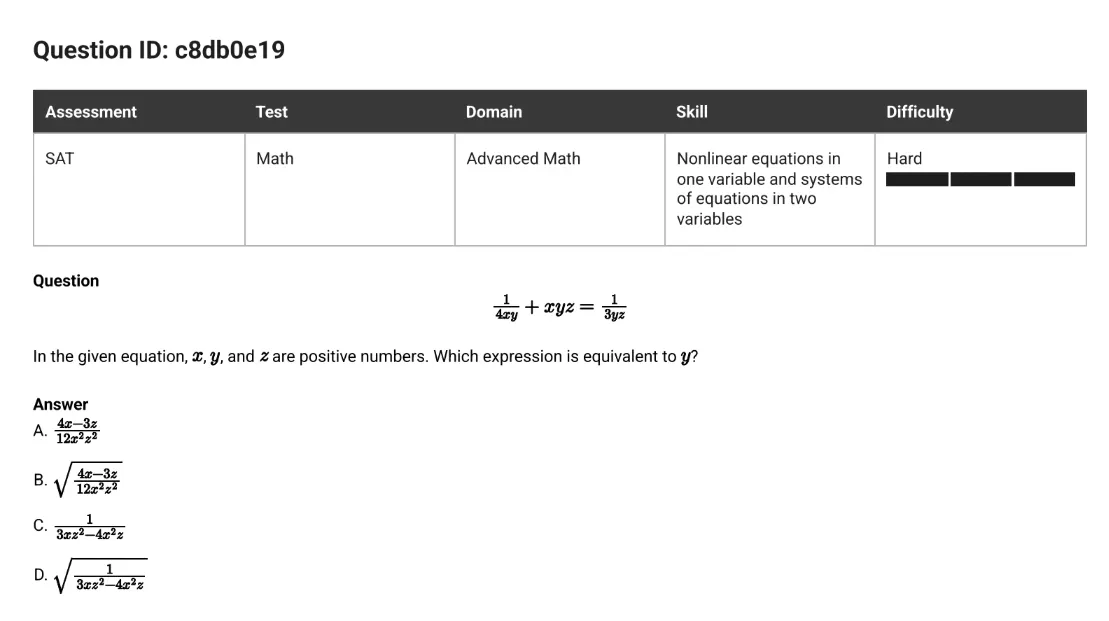
Example 3:
-
Because ONE of these answers are right, then constants x, y, and z that satisfy the top equation should satisfy one of the bottom equations, where the answer choice returns the value of y.
-
Use non-tabular regression:
-
Because x and y are default variables, use x1 and y1 to avoid errors.
-
Since x1, y1, and z1 are all positive already, test each answer choice by transcribing them into the equation editor.
-
Find solution: C.
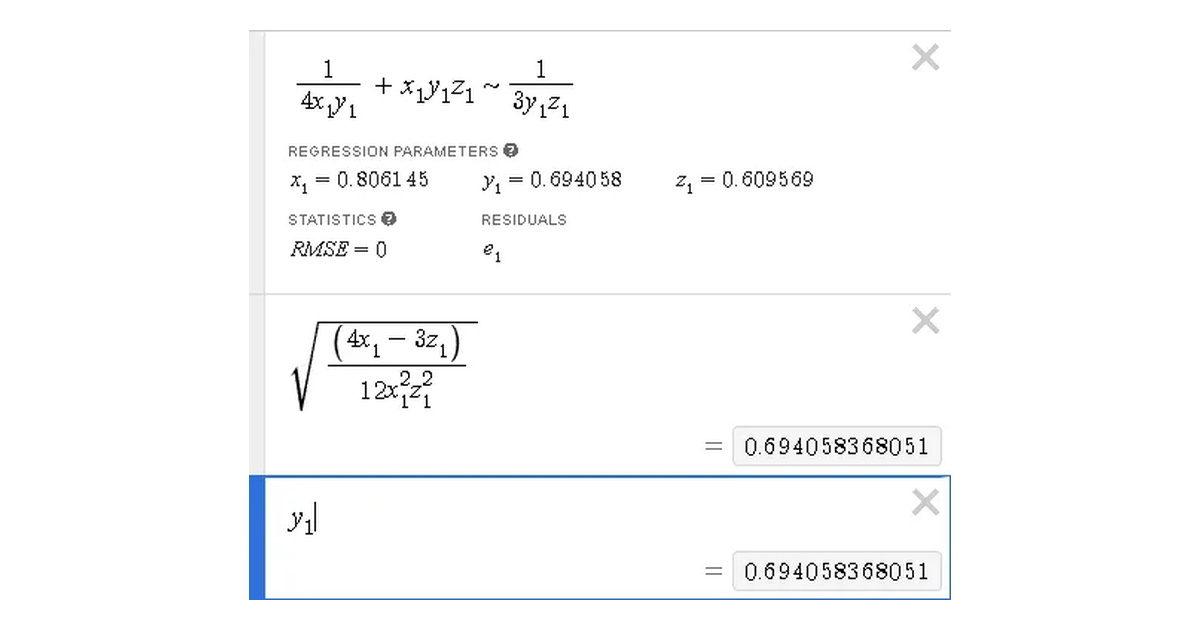
Tip 1: be creative! Use Desmos’s auto-solver to do less written work. ALWAYS use Desmos if you can’t immediately find a solution.
🥈: Solving and Inequalities
Most of the time, use Desmos.
Example 1:
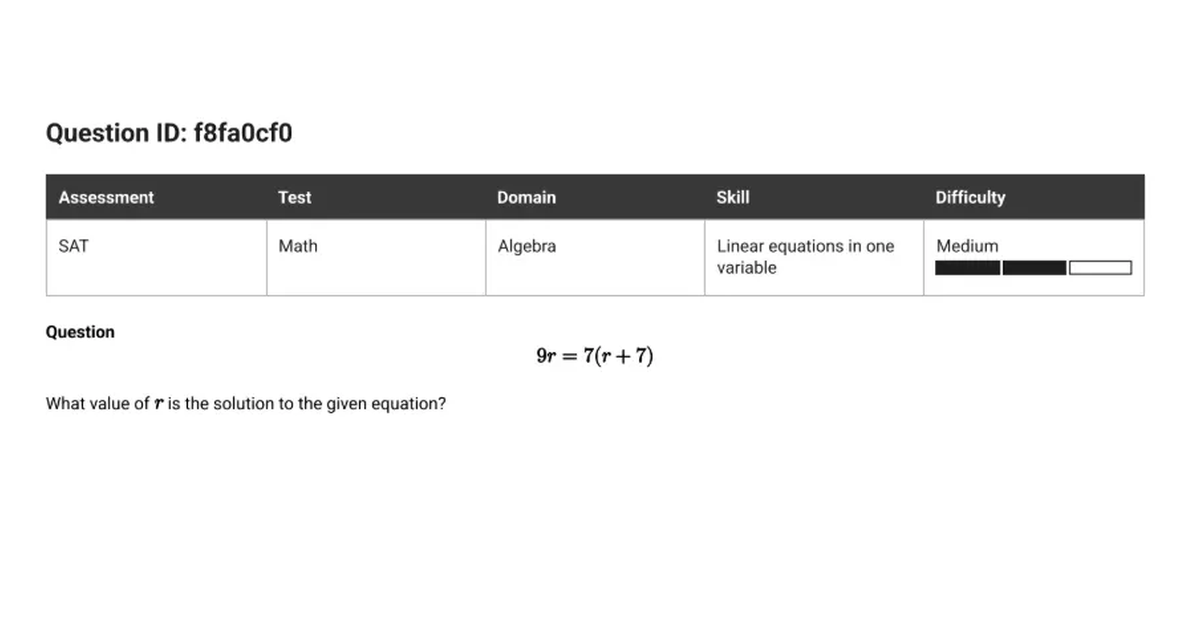
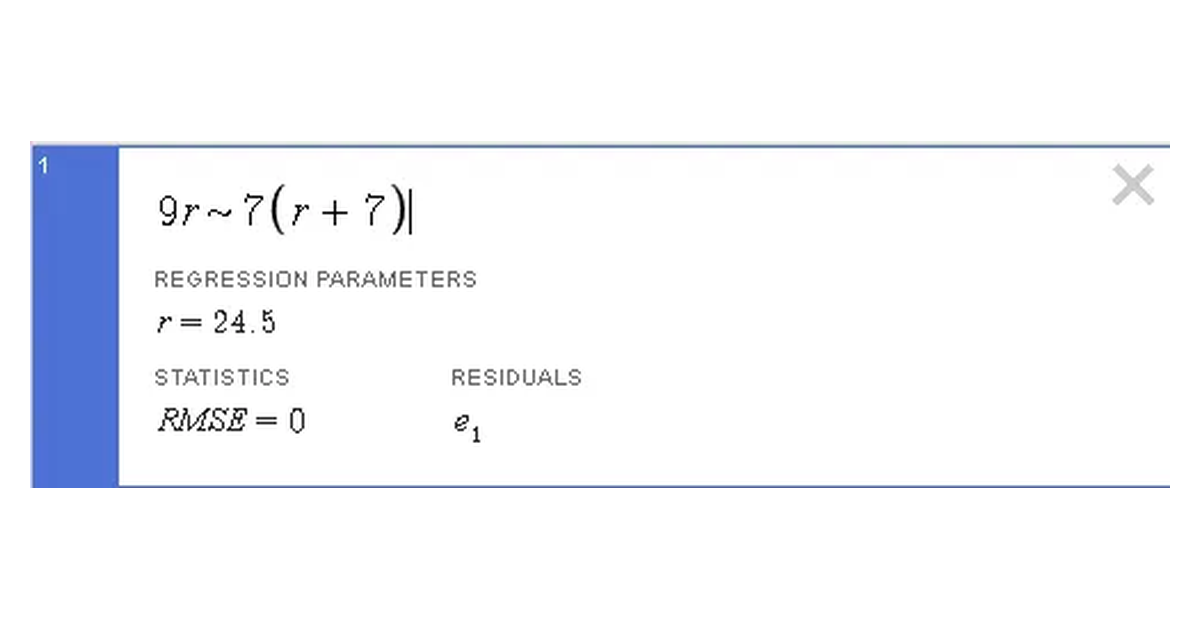
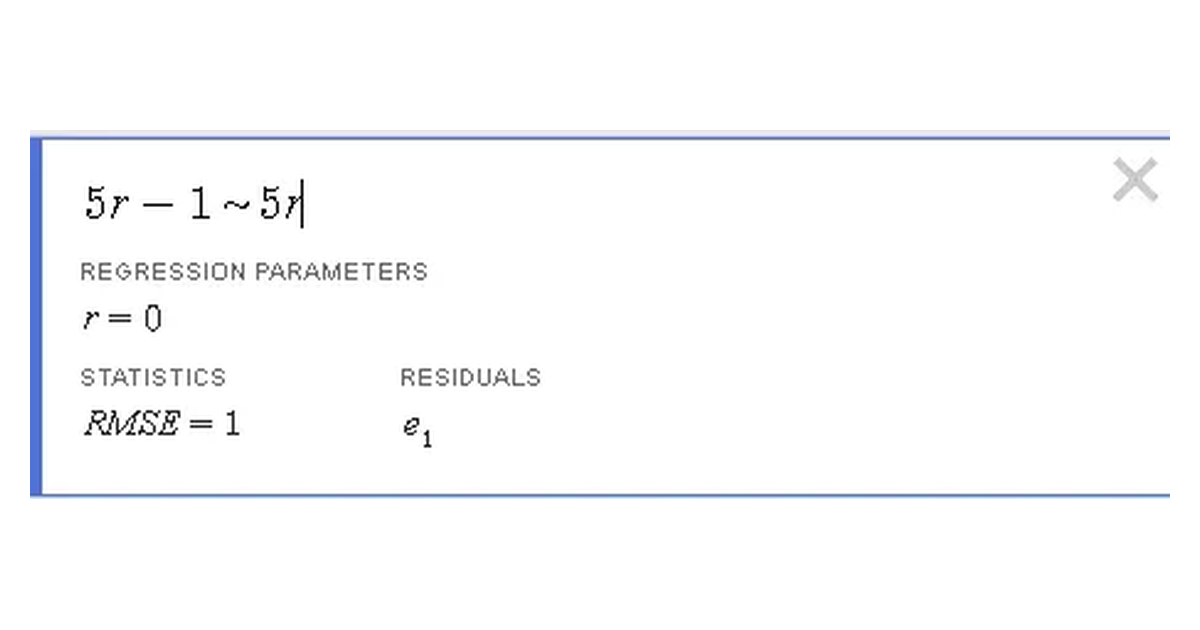
- Regress: transcribe problem, switching out the “=” for a “~” to get 24.5 = r.
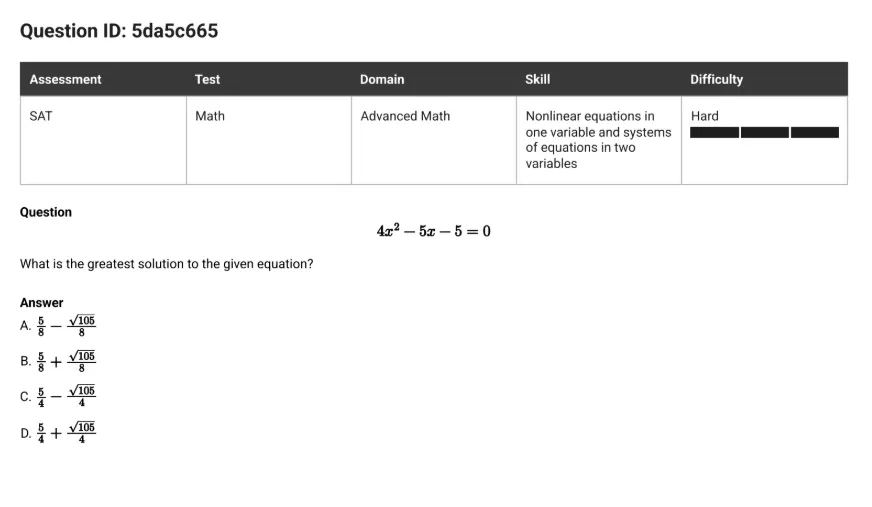
Example 2:
-
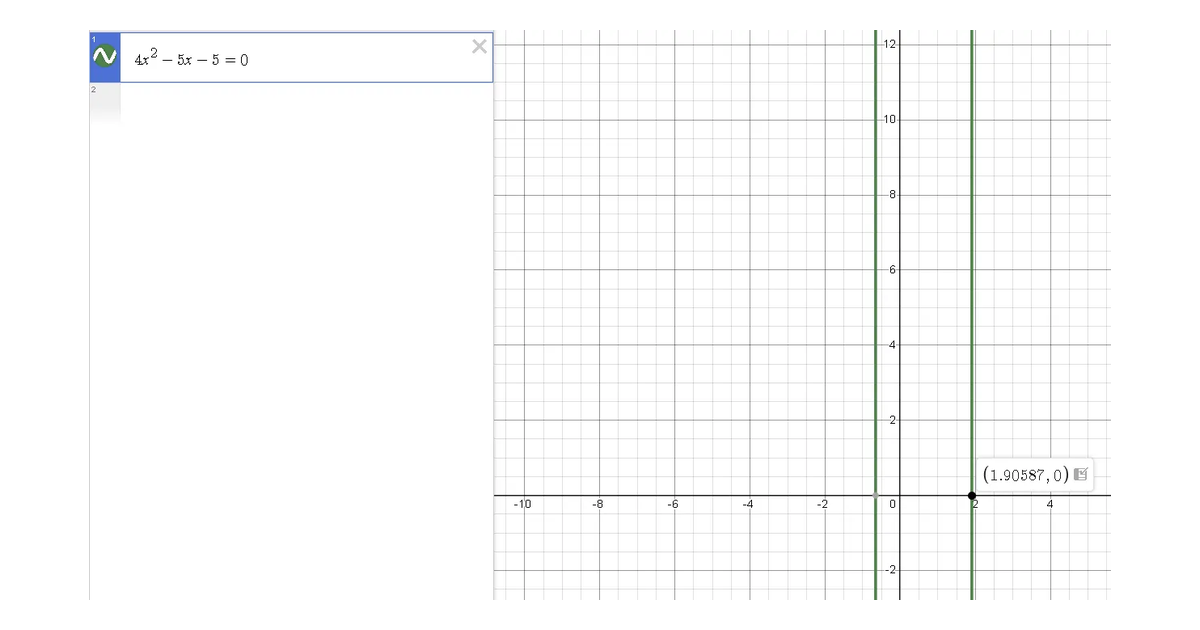
Transcribe and graph equation onto the equation editor.
-
Find greatest solution based on vertical lines and their intersection of the x-axis (below)
-
Correlate with given options: B.
Example 3:
-
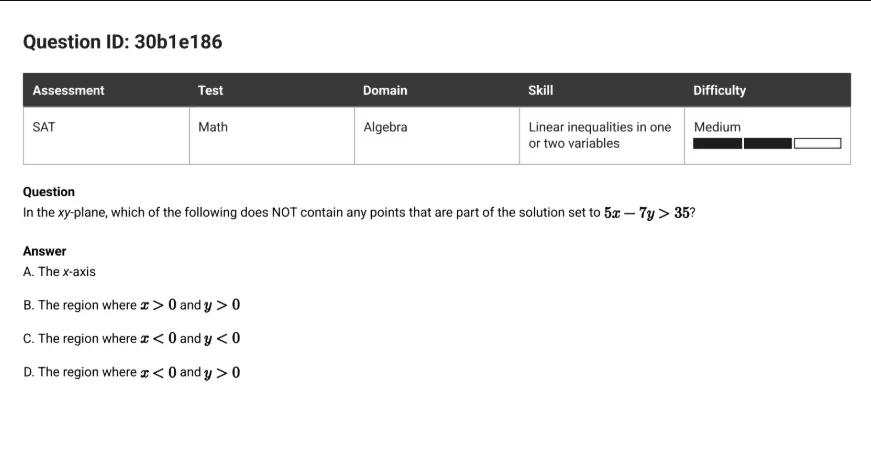
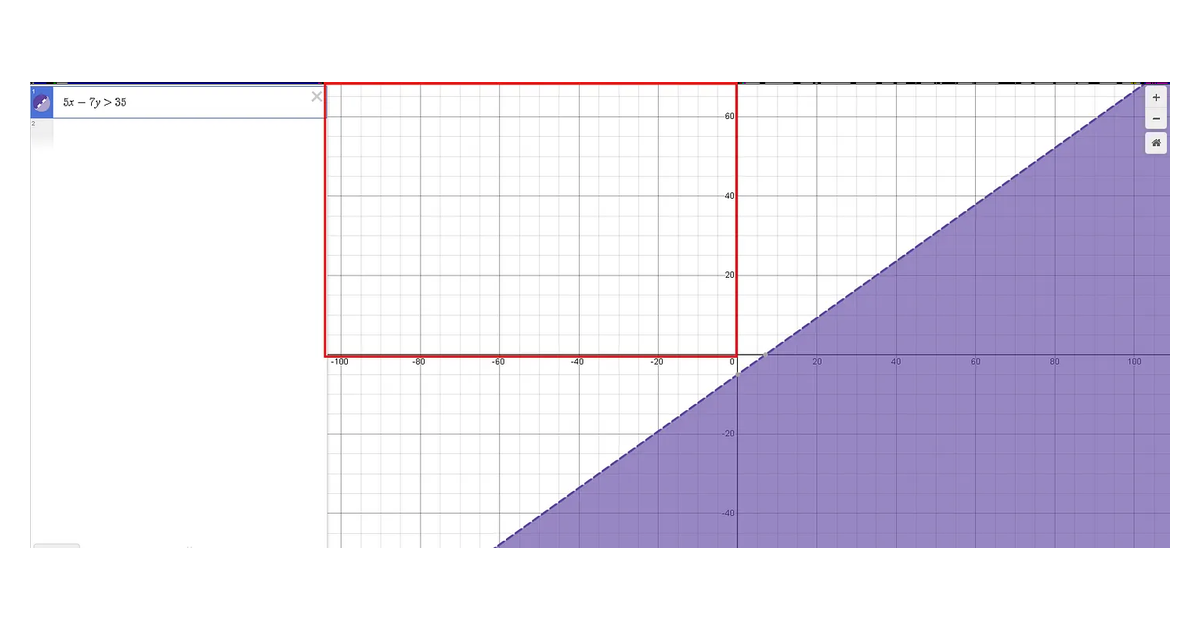
Transcribe inequality on the equation editor.
-
Look for the quadrant where no point exists that satisfies the inequality: only quadrant II is safe!
-
Thus, it’s the quadrant where x < 0 and y > 0: D.
Tip 2: When solving, look for the RMSE metric; if significantly large, something went wrong with your regression!
🥉: Statistics and Circles
Might save you time, might not.
Example 1:
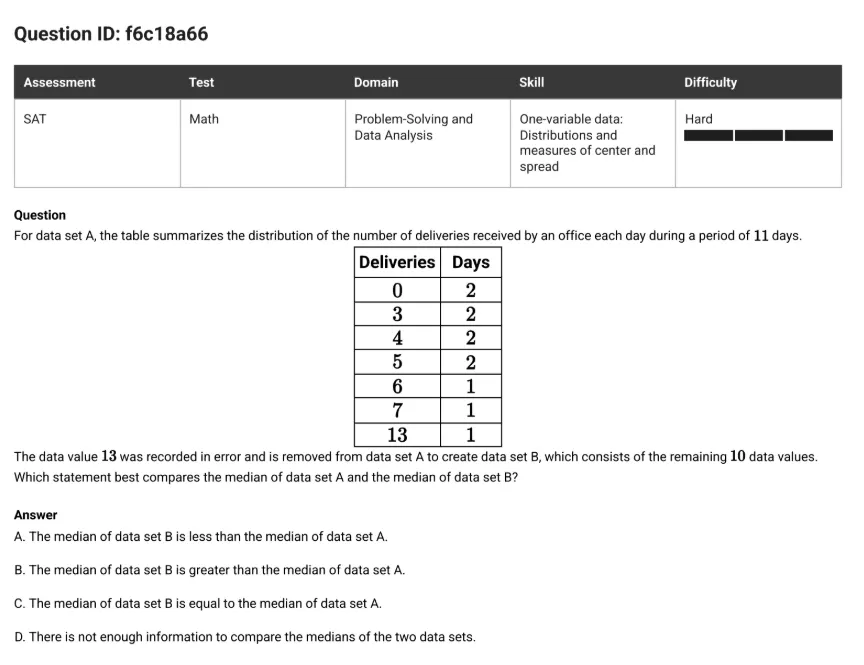
- Though you can transcribe the data set over and compare median(A) over median(B), mental math can conclude that the answer is: C.
For example:
-
Since A has 11 terms, median(A) = A6 = 4
-
Since B has 10 terms, median(B) = A5.5 = (A5+A6)/2 = 4
Example 2:
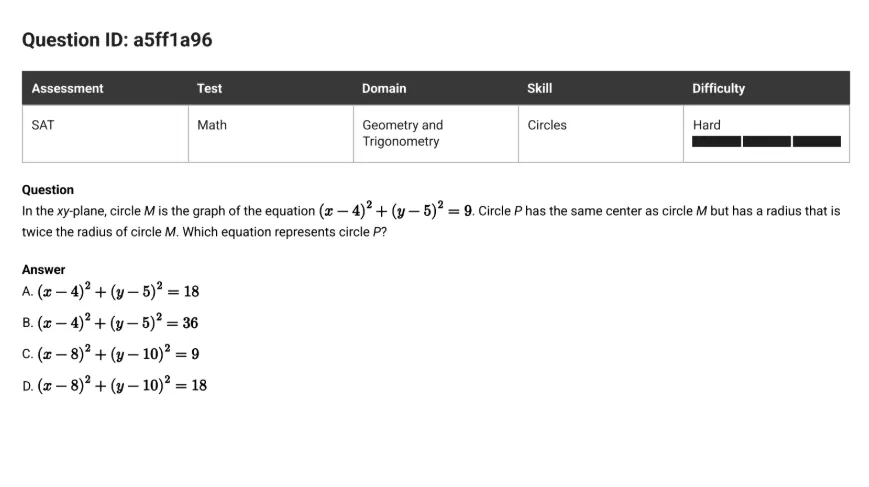
- This question relies on mainly conceptual understanding; but if you forget the general equation of a circle, Desmos can help derive the equation of a circle.
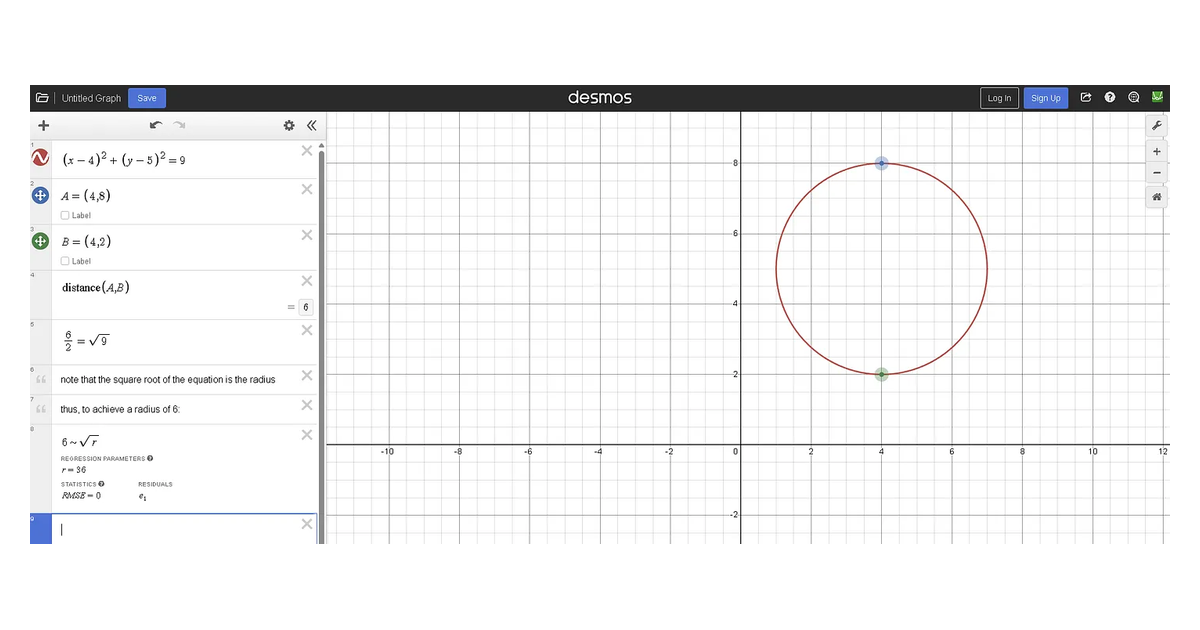 TOO MUCH WORK.
Instead:
-
Recall that the square root of the general equation of a circle returns the radius.
-
Since the radius of M is 3, and we want a radius of 6 (3*2), the general equation must have a 36 in it: B.
Tip 3: for these, pay attention to whether you can use reasoning and mental math over Desmos. Memorization saves more time!
🗑️: (Geometric) Interpretation and Probability
Just don’t.
Example 1:
-
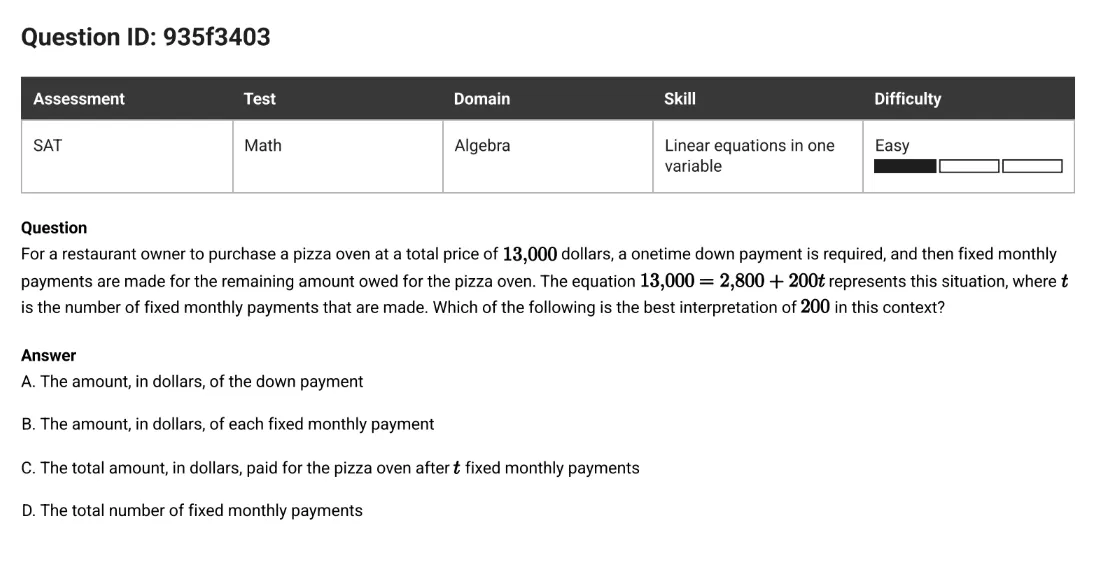
You’re cooked if you need Desmos to visualize this: instead, focus on the concepts behind linear graphs.
-
Because 200 is the slope, each monthly payment increases the amount paid by 200.
-
Thus: B.
Example 2:
-
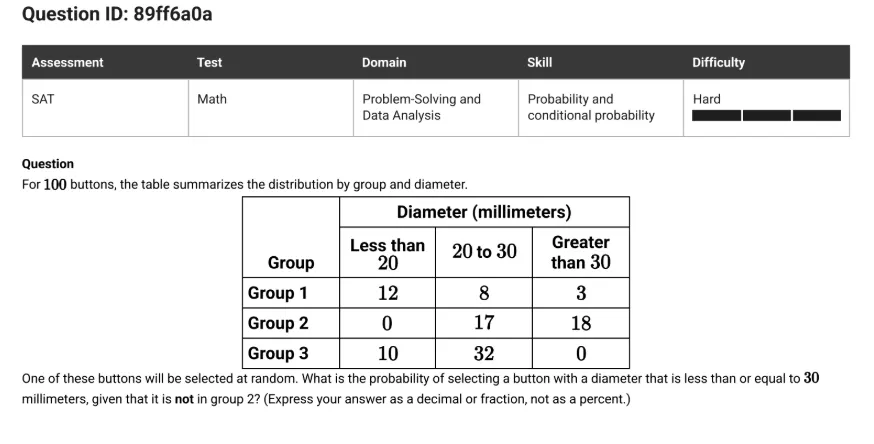
Besides the arithmetic and fraction conversion, Desmos can NOT visualize probability: just use what is given here to solve this question.
-
Memorization and practice are key for doing geometry and probability. Desmos can’t save you!
- Given that it is not in group 2 = limits total to 100 - 17 -18 = 65 buttons; P(greater than 30) is now 3/65, so P(less than or equal to 30) = 62/65.
Tip 4: focus on these the most when doing math on pen-and-paper!
Conclusion
Is Desmos dead on the August SAT? Probably not. Can you rely on Desmos only for the upcoming test? Also, probably not. As more questions regarding interpretation appear, specifically exponential base “displaying” and more geometric identities, it’s important to actually learn the math before using Desmos to try to automate it.
To practice both the concept and the automation, I recommend a three-step process:
-
Do the actual problem.
-
If you get it right, learn the Desmos through YouTube or AI help.
-
If not, that’s OK! Relearn the concept until mastered through Khan Academy, then learn the Desmos.
That way, we can avoid being “Desmos warriors”.
“Victorious warriors win first and then go to war, while defeated warriors go to war first and then seek to win.” — Sun Tzu